It’s almost a year since we were thrown into remote working, yet leaders still don’t really know what’s going on in their organisation.
Today’s unique and ever-developing business problems continue to defy the answers of traditional management methods. Largely, this can be put down to the complete shift in the way that work is happening. For almost a year now, work has occurred behind closed doors on kitchen tables, in bedrooms, at makeshift desks and via digital workplace tools.
Distributed work in itself is not the problem. In fact, the potential benefits of this mode are well documented by now. Time with family has increased, productivity has been somewhat surprisingly high, and more flexible working hours can prevail. Workers can, in theory, be more organised and thoughtful about their work schedule, avoiding the long commute and instead being choiceful about when, how and where they work. This means that they could be more useful to their employers than in a pre-Covid world.
Of course, there are plenty of counter arguments. The beginning and end of the working day are blurred, the cost of productivity often means long hours, and opportunities to collaborate efficiently with your team may be compromised. After all, it is the impromptu conversations with colleagues that promote creative thinking or even breakthroughs in problem solving, and these can rarely occur when pre-planned Zoom meetings are the standard.
All of this is underpinned by some significant home challenges: available WiFi bandwidths, teaching children while schools are closed, and the ongoing national anxiety for yours and your loved ones’ health.
So herein lies the problem.
- Who is well integrated within their team?
- Who is a remote work influencer?
- How is my team feeling about this period of transition?
- How are my new hires doing?
Organisational Network Analysis is the gateway to understanding your people and systems
Organisational Network Analysis (ONA) measures patterns of collaboration, communication and the exchange of information to provide valuable insights into how work really gets done in your organisation.
All organisational networks are unique and they rarely follow the formal hierarchical structure that is adopted by leaders to make decisions and deliver information.
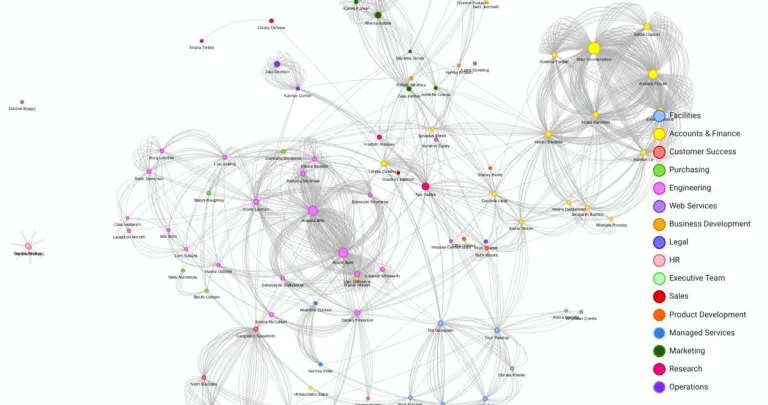
Temporall ONA visualisation of nodes and connections within an organisation based on system integration data. The visualisation displays a number of nodes on the periphery of the network map; employees with very few – if any – connections. Filter this data on Temporall to get to the heart of what that means for your organisation.
Sometime you may even want just a tex block
The visualisation consists of nodes (people) and connections, which form the foundation for understanding how information and knowledge in your organisation is really flowing, can flow, and critically – how it should flow. It provides a new lens for your evaluation of the way work gets done.
Workbench’s ONA feature maps the connections that are being made using a combination of insights based on what people say, what they do and how they do it.
All by using the data harnessed in digital workplace tools like Slack, MS Teams and Workplace, and insights directly from people’s feedback.
ONA showcases critical information including:
- The most influential people across the organisation, where are they located and who they communicate with the most
- The strength of relationships between departments, employee levels and office locations throughout the company
- The individuals who facilitate the flow of information and knowledge within their team
- Areas of the organisation that are lacking valuable connections and risk being siloed
- Individuals who are championed as change agents throughout a period of transition
In real-terms, ONA provides a logical and trackable measurement of collaboration across demographics. You can track new hire integration, understand the informal bubbles of productive groups, leverage your innovation influencers and agents of change – just to name a few of its potential uses.
ONA enables you to harness Behavioural Science techniques and leverage employee’s relative to their individual strengths and networks. By fully understanding the intricacies of your network structure, you can work to replicate patterns of success that you see on your ONA visualisation to drive constant improvement.
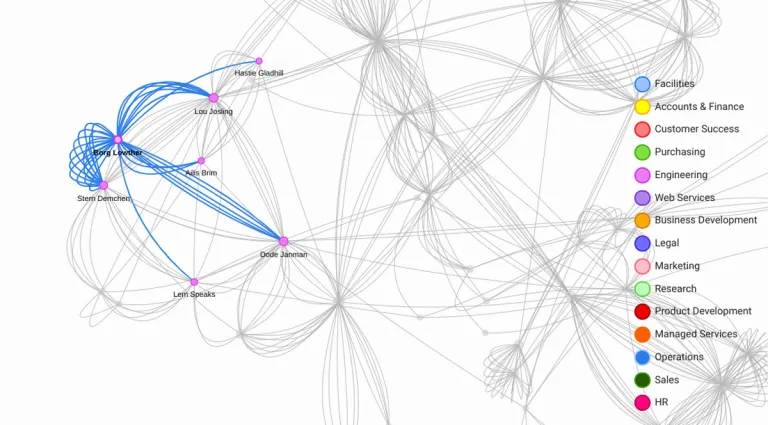
A closer look at a visualisation of ONA on Workbench, focusing on an individual who is relatively central to the organisational network. The density of ‘strings’ refers to the number of interactions the individual has with another employee. Despite the individual appearing to be particularly conversational, their main interactions lie only within their own team (pink nodes) which may suggest a lack of cross-team collaboration.
This consideration of informal networks and mapping the realities of an organisation – as opposed to the formal hierarchical and expected way of working – allows you to understand the most productive, innovative, supportive and sustainable practices, and then replicate them.
ONA on Workbench shows you how things are getting done beyond just the human capital and with a greater consideration for social capital; the networks and relationships that really facilitate work getting done. It’s an essential tool for any leader, but particularly when dislocation and disconnection is rife. Use Workbench’s ONA to map your organisation beyond the traditional organisational chart and create the best workforce possible by operating modern tools to help not hinder your organisational effectiveness.
Contact us to see how our Digital Workplace Analytics platform can help you drive better business outcomes.

