Innovation never stops at Temporall. So to keep you up to speed, we update you every month with what's new on Temporall.
We’re continuously investing in expanding our digital workplace analytics platform capabilities to drive more value and better business outcomes for our customers.
In February, the Temporall updates focused on making the Analyst’s life easier so their insights and reporting can deliver even more value across the company. And you are empowered to accelerate growth.
See how work happens across multiple tools - or just the one
Your digital workplace consists of multiple tools.
Multiple ways of communicating. Multiple ways of collaborating. And differing levels of adoption, usage and impact across the company.
It’s in these digital environments that the majority of work now happens at your company. But when it exists in so many different pockets, it can be difficult to scan the company to see patterns in workplace habits.
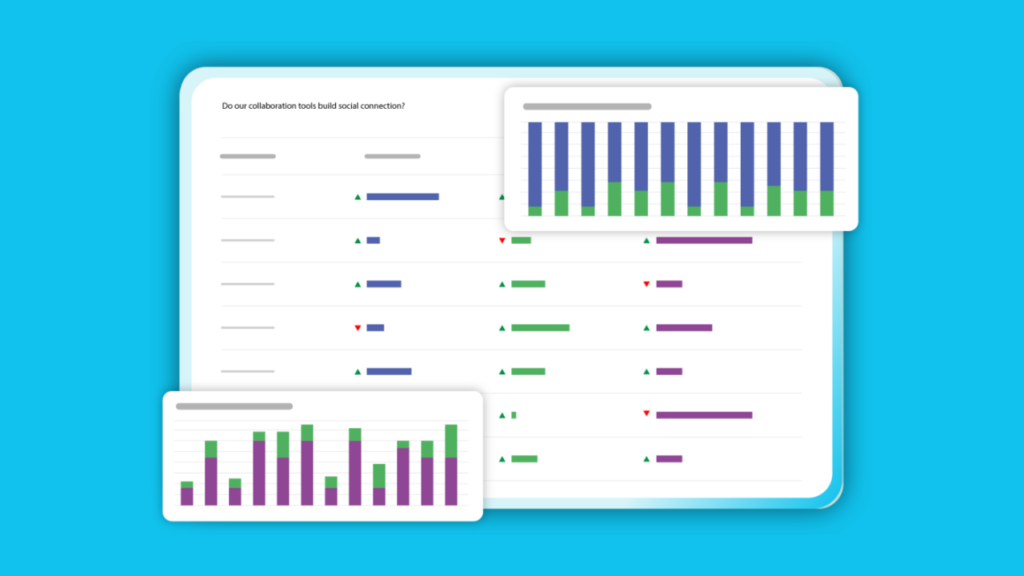
Temporall empowers users to connect all of this data into one simple card for the days you need to take it back to basics and understand ‘How does work get done?’

Filtering has just got deeper

When analysing how work gets done in your company, it’s important to understand when working habits are a result of your internal processes and policies, or whether teams are subject to external forces.
For example, your UK-based Account Management teams may often be asked to join a US-based client’s meeting. Or your Marketing team’s frequent email activity may be due to a number of external agencies getting in contact. Similarly, your services team could be mirroring the Slack channel usage patterns of a client.
It’s therefore important to be able to understand the nuances of your company’s communication and collaboration activities.
With Temporall, users can view all cards by all data, or broken down by a number of filters.
For example, you can view the distribution of all meetings vs. internal meetings vs. external meetings that the UK-based Account Management is being asked to join,
This is available on all cards where multiple data options are available, for example, in Slack channels, this includes differentiation between open, closed and all channels.
Improved sorting for slicker analysis
Metric cards that are filtered by demographics can now be sorted in a number of different ways: A – Z, Z – A, Lowest – Highest and Highest – Lowest.
This sorting enables users to quickly understand the areas of your company that may need immediate attention.
For example, when asking ‘When do we work?’, you can sort this by the departments that are working outside of working hours the least to most or vice versa.
It empowers the rapid understanding of those areas of the company that have anomalous and potentially harmful working habits, so you can dive further into the data and drive change where it really matters.


